Working in partnership with over 8,000 customers in 27 countries, anecdotally we hear echoes of trends and movements across the hospitality industry. But greater than hunches and feelings, it’s hard data that paints a true picture, in real-time, of the ever-changing order of global hospitality.
In three years, the industry has been upended umpteen times and business owners have pivoted, pirouetted and ploughed onwards. A week may be a long time in politics, but it’s a long time in the modern restaurant game too.
Flipdish data is brimming with insights, but we don’t look at our data in isolation. Here we collate data from multiple sources including the Flipdish platform, government agencies, database services, other food tech providers, our customers and the media to support and guide foodservice professionals for the here and now, and the future.
What’s discussed?
1. Dine-in is back to 2019 levels, but with one caveat
2. Inflation is on the menu
3. How customers order is changing
4. Takeaway and delivery are here to stay
5. It’s time to say adios to the aggregators…
6. and say hello to significant savings
7. Loyalty is everything (but you knew that already)
8. Bank holidays drive the biggest ordering spikes
9. Dark kitchens are now business as usual
1. Dine-in is back to 2019 levels, but with one caveat
Good news comes from the global data provided by restaurant reservation platform OpenTable, which has tracked the number of seated diners visiting restaurants compared to 2019. While numbers somewhat recovered during the latter half of 2021, so far in 2022 (01 January to 16 May), seated diners at restaurants from online, phone and walk-in reservations are on average only 2% down on 2019 levels for the same period. A huge triumph when you consider that the 2021 average was -43% on 2019 levels for the same period.
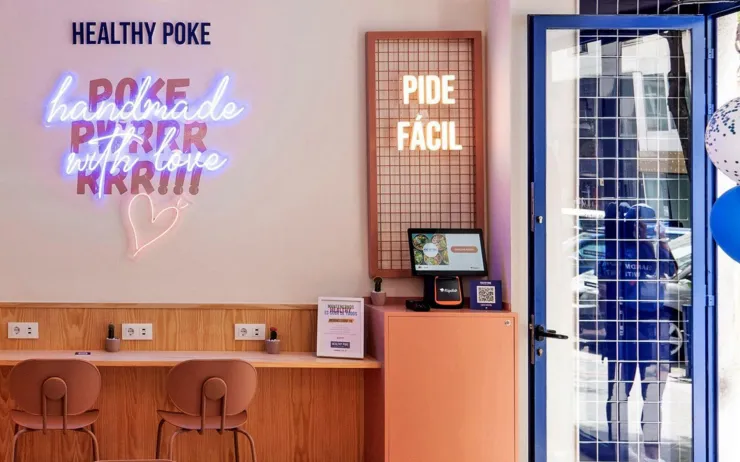
However, this bounce back of seated diners also comes during a global staff shortage. While some restaurants are reducing opening hours and days to cope with shortages, others, like Samsi in Manchester have totally transformed their businesses with QR Code Order & Pay. Technology has also helped Healthy Poke, a restaurant chain with 26 outlets across Spain, to make its ordering process smarter and faster with in-store kiosks.
2. Inflation is on the menu
2022 has seen sharp increases in operating costs and low cash reserves are stifling some restaurants.
Restaurant margins have always been thin, but now every penny and cent really does count, especially as rising costs of produce, fertiliser, utilities, and labour are set to worsen.
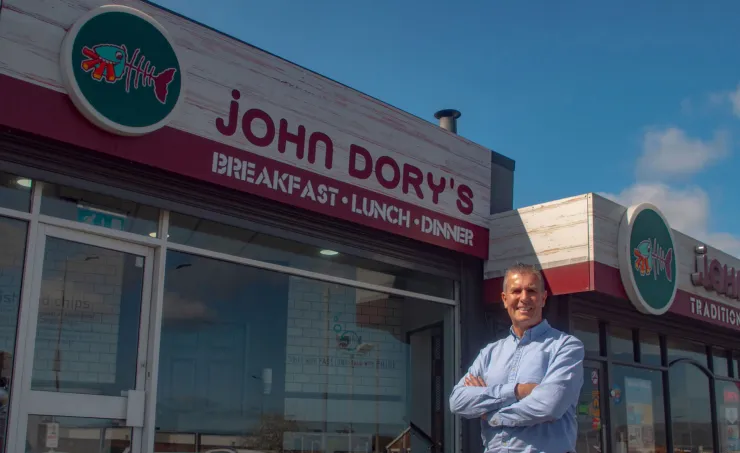
As reports of chip shop and café closures trickle through the news cycle, Flipdish customer Mark Polley, who operates seven John Dory’s fish and chip shops in Northern Ireland, says they’ve seen a “threefold increase in our energy costs”. He also makes estimates for produce prices: “The new season potatoes will be expensive moving forward as again this is impacted by the cost of fertiliser. Predictions estimate up to a 40% increase from the autumn”.
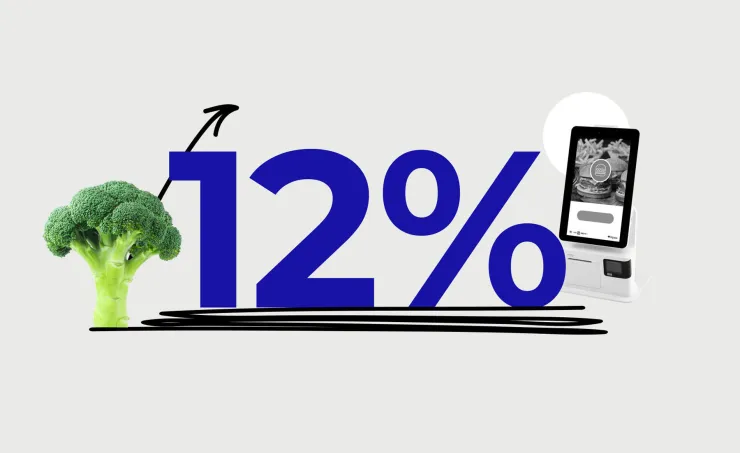
When it comes to balancing the books and the possibility of raising prices, every business has different considerations. However, we can see an increase in average order values and cost per item on the Flipdish platform from the beginning of 2019 until July 2022. When looking at cost per item, data shows this has grown from €8.16 average per order item in Jan 2019 to €9.11 in Jun 2022, a 12% increase.
Inflation is inescapable, and particularly in 2022, is drastic.
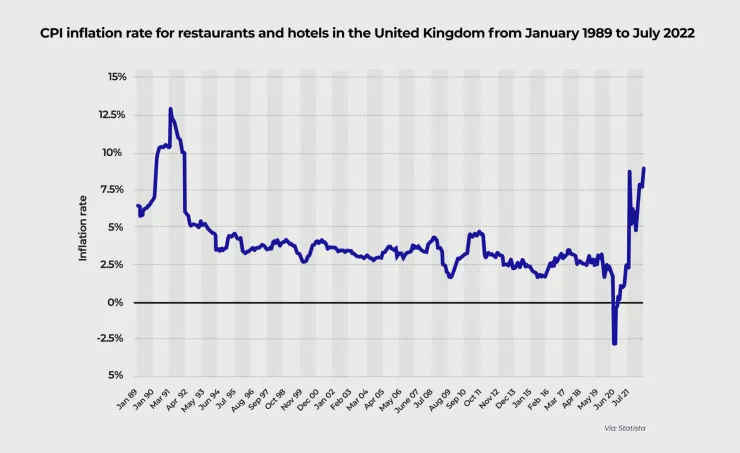
In the UK, prior to November 2021, the inflation rate for the Consumer Price Index (CPI) had remained under 5% since October 2011. However, it rose to a high of 9.1% in May 2022, onwards from 9% in the previous month.
According to Statista, the CPI inflation rate for restaurants and hotels in the UK was 7.6% for May 2022, down from 7.9% the previous month.
Across the Atlantic, the U.S. inflation rate reached 8.6% in May 2022, its highest level since December 1981, as reported by the U.S. Department of Labor (DOL) on June 10. Meanwhile, Federal Reserve data from June 2022 notes that: “Restaurants faced steep food price increases, especially for meats, eggs, and oils, and incomplete pass-through to menu prices resulted in weaker profits”.
Similar inflation increases can be seen in Ireland (8.2% in May 2022), Germany (7.9% in May 2022) and Spain (8.7% in May 2022), and while France’s rate is lower at 5.2% in May 2022, it is still at its highest since September 1985.
3. How customers order is changing
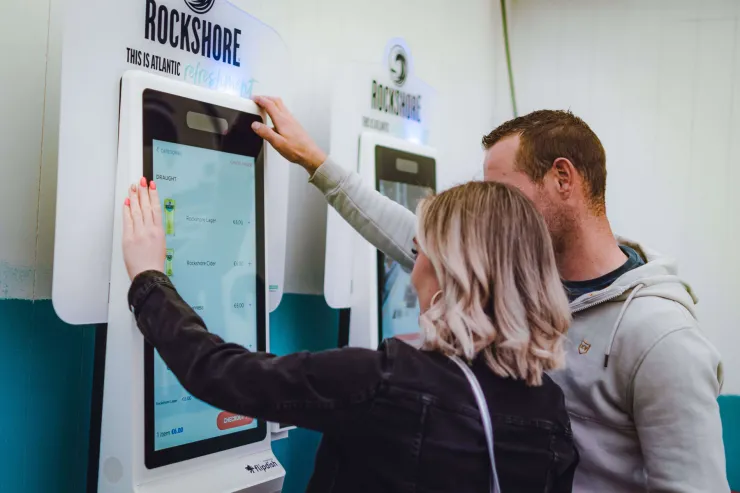
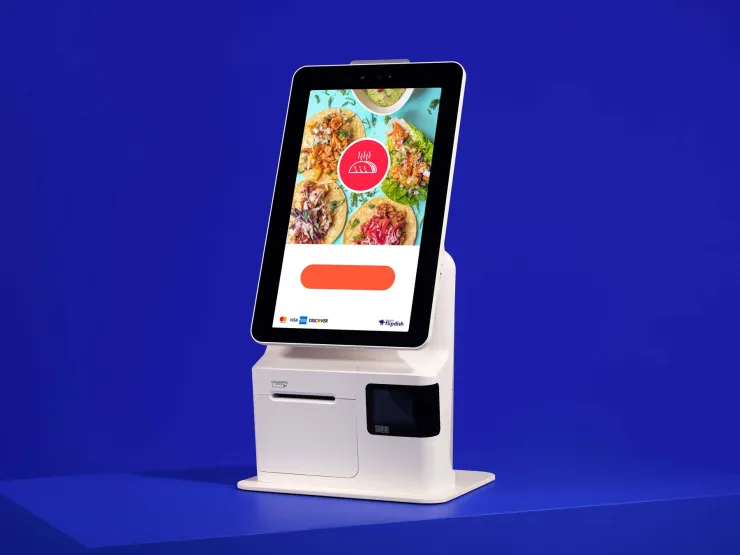
Another major trend is the use of hardware kiosk technology and QR code ordering in restaurants. Although this was accelerated by COVID, the switch is also driven by rising costs, labour shortages, and the on-demand economy.
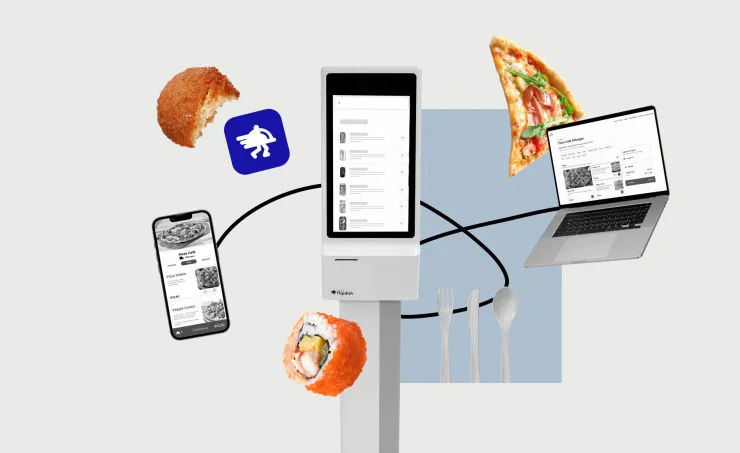
Where face-to-face interactions were once the default, customers are now able to place an order via everything from kiosks and direct-to-table ordering to mobile apps and the web, with a variety of technology options available for both eat-in and takeaway experiences.
We’re seeing a trend of college campus accommodation installing Flipdish kiosks with multi-store order options for delivery and collection, and we have even powered festival drinks ordering with kiosks.
We monitored the most popular ways to order throughout 2021 to see how habits have been changing.
UK
Here, the data shows that there’s been a distinct uptick in the use of these alternative solutions from December 2020 to December 2021
Product | YOY % change |
Kiosk | 17% increase |
Apps | 1,167% increase |
Web Ordering | 68% increase |
QR Code Ordering | 29% increase |
US
In the US, the use of app-based ordering and web-based ordering both saw a significant uptick, rising 66% and 126% YOY respectively.
Ireland
In the Republic of Ireland, our data shows an uptick in use of QR codes, spiking 304% YOY between 2020 and 2021. In fact, all digital ordering channels saw an increase in popularity, with app-based ordering up 12%, kiosks up 79% and web orders also up 23%. This data further shows the rising demand for differentiated digital ordering channels.
Spain
Spain doesn’t buck this trend either, with web-based ordering rising 48%, and app-based ordering up 10%. Unlike the UK where apps saw the largest spike, or the US and Ireland where QR Code Order & Pay saw the largest uptick, our Spanish data shows a huge 695% increase in the use of kiosks, demonstrating varying preferences in different markets globally.
France
Apps are most in demand in France with a considerable 51% YOY increase in white-label own-branded apps by Flipdish, while web ordering grew 24.66% in the same period.
Germany
Web ordering is the runaway product leader in Germany, with a 28.81% YOY increase.
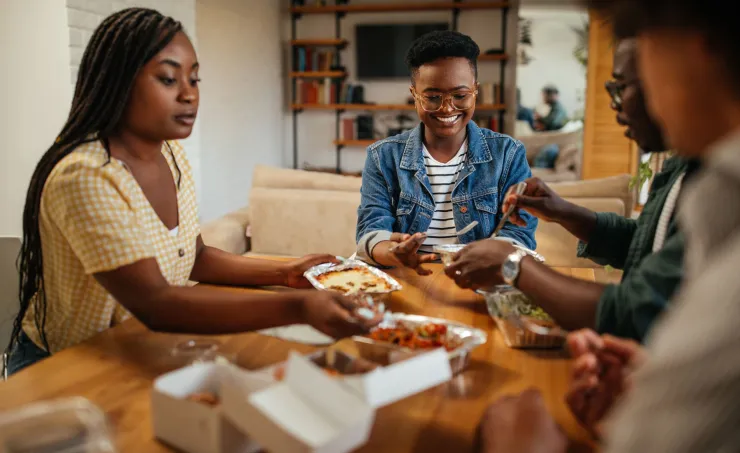
4. Takeaway and delivery are here to stay
Following the takeaway boom during lockdowns and peak COVID, off-premise orders via the Flipdish platform in 2022, so far, are up 50% comparing H1 2019 to H1 2022. Habits and preference changes were accelerated by the pandemic, but it’s clear to see takeaway culture is here to stay.
Globally, aggregators have continued to be a headache for restaurants, taking huge slices of the pie during the past three years especially.
In the UK alone, Deliveroo, Uber Eats and Just Eat dominate the national food delivery market, which reached £11.4 billion in 2020, according to The Lumina Intelligence UK Foodservice Delivery Market Report – double the figure reported in 2015.
Similarly, we can see that aggregators are having the same impact in many multiple markets globally. Industry expert Peter Backman’s estimates that in 2021 alone:
Aggregators in action
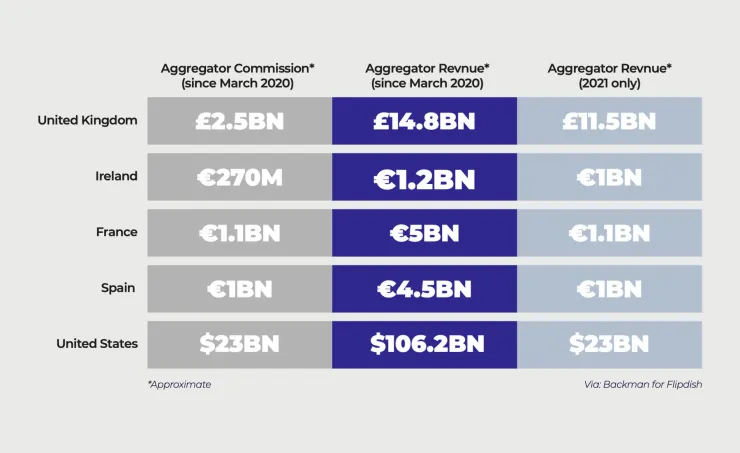
These estimates cement the fact that the growing taste for takeaway is not a short-lived trend.
5. It’s time to say adios to the aggregators…
For the “big three” marketplaces at the top of the food chain, the opportunities are therefore immense, yet these gains often come at the expense of restaurants themselves.
While many restaurant owners feel they must sell through aggregators for the increased exposure the platforms offer, in doing so they are slashing their profit margins — facing commission fees of up to 30% on every order, or even higher.
Given this dilemma, it is easy to understand the grievances of restaurateurs. This was reflected in a UK Flipdish survey at the end of 2021, which showed that:
Nearly a third (30%) of owners felt angry that aggregators were taking so much commission during such a challenging period
A massive 60% had ditched an aggregator platform since the pandemic first started
21% listed breaking away from aggregators as a top priority
As a result, we are now seeing many restaurants successfully leaving aggregator platforms, helping to unlock benefits for the vendor and customer alike.
6. and say hello to significant savings.
Across our customer base, Flipdish customers saved approximately €17m in 2021 using our platform instead of the “big three” aggregators. And in 2022 so far (01 January to 12 July 2022), a further estimated €11m. These customers share a common insight: the way to beat the aggregators is to generate demand yourself.
In Edinburgh, The Pennycook takeaway switched off Just Eat in early March 2022. After refreshing their offers, Flipdish Managed Marketing and a flyer drop, sales immediately increased 61% week-on-week. And after just returning from their July holiday had their biggest week ever — over £14,000 in direct orders vs £5,400 on their last week with Just Eat.
CUSTOMER SPOTLIGHT: THAIDEE
“I used to be a Just Eat flag bearer but the aggregator was directing my customers to my competitors. I like to have a close relationship with my customers but don’t like knowing the big tech company is doing so. Any gains we made during the pandemic have been lost in commission. Now, we turn off Just Eat when we can to avoid paying such high fees. In 2021 alone, by using our own direct ordering system we saved over £30,000 that would otherwise have gone into the pockets of the aggregators.”
Martin Lovell
Managing Director
Thaidee
Cheshire
7. Loyalty is everything (but you knew that already)
Restaurants have known for centuries that repeat custom is key to a thriving business, and Flipdish data supports this acknowledged truth with hard numbers.
Loyalty
Our UK data shows that when a customer receives a loyalty voucher, they will place an additional 12 more orders over the next 12 months on average. Further, the total spend of future orders from those customers is on average nine times the value of the initial and future loyalty discounts.
Retention
After receiving a retention discount, the average UK user will place an additional 3.8 more orders over the next 12 months. The total spend of future orders from those customers is on average ten times the value of the initial retention discount and future discounts.
But wherever you operate geographically, the benefit of ensuring your brand resonates with consumers through such schemes and considerations is clear: across Flipdish customers, average revenue per account is 42% higher among stores with active loyalty programmes.
8. Bank holidays drive the biggest ordering spikes
As well as insight into what consumers order, we have been able to make some important observations relating to when they order, by looking at ordering peaks and the success of certain seasonal items. These country-by-country insights highlight when to ramp up marketing and when restaurants need to consider managing greater capacity.
Several key dates last year yielded spikes in ordering, chief among them public holidays – in particular, Good Friday, Easter Monday, and the May and August bank holidays.
In 2022 so far, bank holidays have seen orders increase by an average of 36% from a typical day in 2022. Bank holiday Mondays in particular have seen orders 52% higher than average, making these vitally important days for restaurateurs to target.
UK
In both 2021 and 2022, May bank holidays were the busiest bank holiday Mondays of the year — falling on 31 May 2021 and 02 May 2022 respectively. So far in 2022 Good Friday (15 April) has topped the bank holiday orders lists, up 117% on the previous Good Friday. This echoes the numbers for 2021 which also rank Good Friday as the busiest of all the public holidays.
2022 saw spikes during the four-day bank holiday weekend for the Queen’s Jubilee starting on Thursday 02 June, which saw orders increase to 54% higher than average, and while Friday and Saturday remained fairly standard, on Sunday, orders were 23% higher than an average Sunday.
Overall from Thursday to Sunday, orders were 14% higher than a typical Thursday to Sunday.
IRELAND
In Ireland, 18 March 2022 was the busiest bank holiday for orders, up 70% on the year before. The one-off bank holiday was held in commemoration of those who have lost their lives to COVID-19 and to recognise the work of frontline workers during the pandemic. It came directly after St Patrick’s Day on March 17, and was day two of a four-day weekend. The next busiest bank holiday was at Halloween on the 25 October 2021, where orders were up 4.4% YOY. This was followed by the August Bank Holiday on 02 August 2021, up 34% YOY.
US
In the US, Labor Day is the holiday with the most online orders, and in 2021, this day had an increase of 200% in orders YOY. Though not a holiday, Super Bowl Sunday also had a significant increase in orders, up 80% on that same day the previous year.
SPAIN
In Spain, Easter Sunday (17 April 2022) had the largest number of orders on a bank holiday for 2021 and 2022 so far, when orders increased 37% on the Sunday before. In second place is the Ephiphany on 06 January 2022, where orders increased 41% YOY. Maundy Thursday on 14 April 2022 takes third billing for most bank holiday orders in Spain.
GERMANY
The busiest bank holiday for orders in Germany was Children’s Day on 03 October 2021, up 112% YOY, followed by Labour Day on 01 May 2022. Other busy days were Mother’s Day and Father’s Day.
FRANCE
In France, the busiest bank holiday day for orders was Good Friday on 15 April 2022, up 41% YOY. This was closely followed by Music Day on 21 June 2022, which is not an official holiday, however, the Flipdish platform saw an increase of 90% in orders on this day YOY. Labour Day on 01 May 2022 was the third most popular, followed by Mother’s Day.
Overall, the data tells us that customers who put their brand front of mind ahead of bank holidays and national celebrations will reap the rewards.
9. Dark kitchens are now business as usual
Dark kitchens, ghost kitchens and virtual brands have gone from disruptive trends to business mainstays in just a short couple of years. Flipdish powers hundreds of ghost kitchens and virtual brands around the world, but North America is really setting the pace for innovation and evolution.
Virtual concepts like All Day Kitchens use Flipdish kiosks to capture on-premise revenue, Q-ZN partners with Flipdish to build a multi-language website and app and Popchew uses Flipdish technology to grow their virtual brands, with a strong focus on influencer/creator brands.
TikTok is the channel of choice for virtual brands targeting youth, and increasingly older demographics. Popchew hit the mark on TikTok with 1.5m likes and counting, while fellow Flipdish customer MrBeast Burger is reaching highs of 7m likes and upwards with a growing fanbase of 1.5m followers.
For many of our ghost kitchen clients, kiosks are where it’s at. Restaurant kiosk technology can be found in ghost kitchens:
- by the entrance
- in the waiting areas for driver pick-ups
- in food halls / customer dine-in sections
From H1 2021 to H2 2022 kiosk use increased 490% showing enthusiastic customer adoption, and accounted for 63% of ghost kitchen orders. And without years of brand building behind virtual brands, digital advertising, loyalty, and retention programmes are a must.
Our Flipdish Managed Marketing team helps virtual brands across the world and found that customers using loyalty programmes ordered three times more during H1 2022 and clients saw ROI of 552%+ in the same period when investing in retention campaigns.
We already know that loyalty is everything, but no one knows that more than virtual brands, who must be successful at creating loyalty and engagement. Without having a physical premise, it's all about that virtual connection, something traditional restaurants need to embrace for continued customer engagement too.
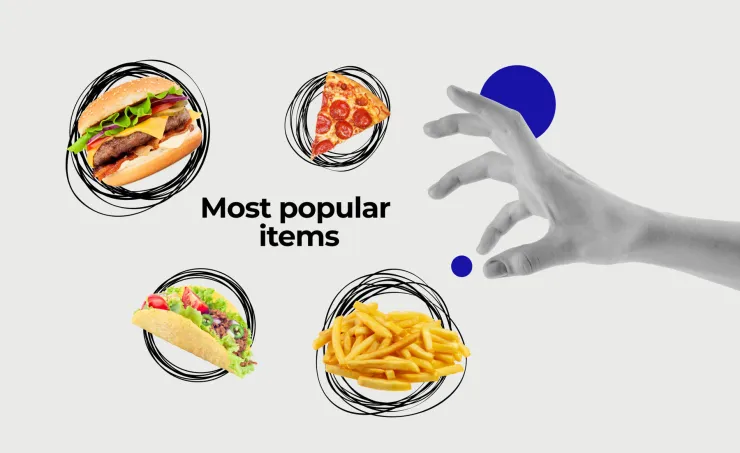
Food Trends Spotlight
1. State of the takeaway nations
Based on Flipdish data obtained from thousands of restaurants of all shapes and sizes from the UK, US, Ireland, France, Germany and Spain, we are able to paint a detailed picture of what food preferences are underpinning the sector in each market.
______
In Britain, chips accounted for 14% of items ordered in the first half of 2022, and are big sellers everywhere from chippies to Chinese restaurants (the third most popular cuisine so far in 2022) and pizza joints.
Chips shops are Britain's most popular cuisine type, accounting for 29% of all orders. Across all cuisines, cheese burgers, egg fried rice and pizza made up the top items ordered after chips. Meanwhile, garlic naan and curry sauce just missed out on the top 10.
______
In the United States, Mexican appears to be the nation’s favourite, with 25% of all orders falling into this category, well ahead of the next most popular categories of seafood/southern American (7%), Mediterranean (3%) and Asian fusion (2.8%).
This pattern is reflected when drilling down into the data on most popular individual items. Here, chicken burritos (4.2% of all items ordered) come out on top, with sides of tortilla chips and guacamole also making the top three. Shrimp (1.9%) is among the few items from other cuisines to break the Mexican monopoly.
______
In Ireland chippers are by far the most popular cuisine type with just over 37% of orders, followed by pizza in second (14%) and Chinese in third (5.8%). While Mexican was the most popular takeout of choice in the US, in Ireland it sits well outside the top 10 and accounts for less than 1% of orders.
Irish consumers love their chips, which makeup almost 16% of orders, with battered sausage, cheeseburger, chicken burger and curry sauce completing the top five most-ordered items.
______
Data from Spain tells a different story. Here, pizza is the number one takeaway cuisine (23.76% of orders), closely followed by sushi (21.17%). Burgers, Chinese, Indian, Asian fusion and Spanish cuisine are among the other popular choices.
______
Flipdish stats from France show tastes to be a little more expansive than in other countries, with lower percentages and more varied menu items across the board. Cheeseburgers are the most commonly ordered food item (4%) in Flipdish-powered restaurants, followed by naan fromage (2.86%) and frites (2.69%).
______
In Germany, burgers and fries take up the top six spots. Cheeseburgers reign supreme (19.63%), followed by chicken burgers (4.51%), fries (6.8%), steak fries (3.84%) and quarter pounders (3.24%), Also high ranking are sweet potato fries and margherita pizza.
______
2. Veganism is on the up and up
The global rise in popularity of vegetarian and vegan food choices is clear to see through numerous data sources. During 2021, Google searches for ‘vegan food near me’ saw an increase of more than 5,000%.
Globally, there are an estimated 1.5 billion vegetarian consumers, while in Europe, according to The Vegan Society 11,655 vegan food and drink businesses were launched in 2019, an increase of 93% on the number recorded just three years earlier.
In the UK, 7.2 million adults currently follow a meat-free diet. Worldwide, record numbers of over half a million people signed up to Veganuary in 2021 and this increased further to 629,000 participants in 2022.
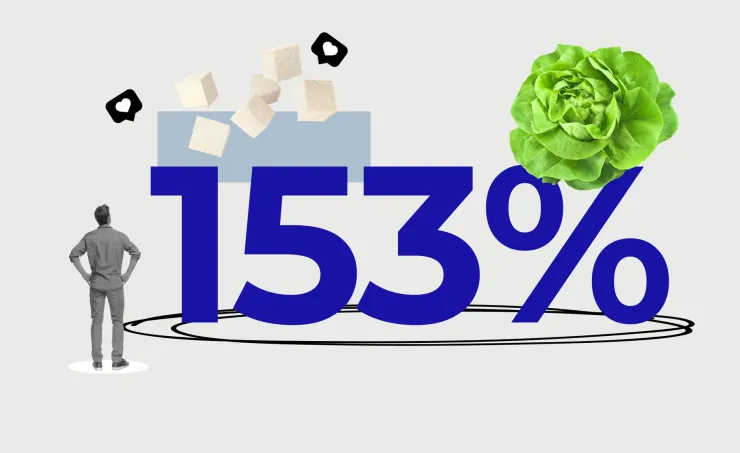
These upward trends are echoed with global orders for vegan food across the Flipdish platform seeing a huge 153% increase from 2020 to 2021. As for vegetarian items ordered in 2021, Flipdish data shows that the most common choices are vegetarian spring rolls, rice dishes, vegan curries, vegan fried chicken and vegetable/margherita pizzas.
3. Iced coffees are not just for summer
As well as public holidays, hospitality business owners should also be aware of seasonal trends, updating menus and offerings to align with consumer buying patterns at certain times of the year.
For example, we tracked the sales of pumpkin spiced lattes through the course of 2021. Orders spiked in September, peaked in October, and remained high in November. This shows that items relating to Halloween are likely to be successful not only on October 31 itself, but several weeks, and even months, pre and post.
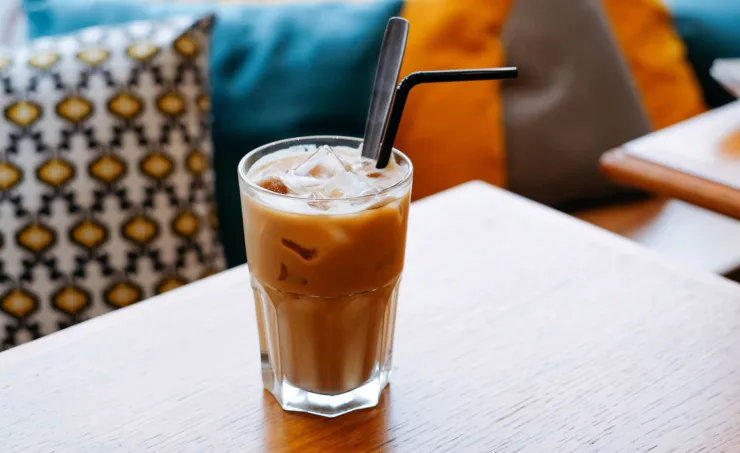
Similarly iced coffee provides another insightful snapshot. As expected with the seasonal weather changes, order volumes rose sharply from March and remained high through the summer months. However, sales were also more or less sustained at spring levels throughout the autumn months of September, October and November. This suggests that even in the cooler months, restaurants can enjoy success in selling iced products.
Flipdish Futures: Now is the time to prepare for success
These are pivotal years for the global hospitality sector. The pandemic has rapidly transformed how, what and when customers order takeaways and has simultaneously transformed the dine-in experience. Not only has the crisis altered ordering habits, but it has resulted in increased costs for goods, rising energy costs, and an even more deflated labour market across the board.
But the rise in popularity for off-premise isn’t going away. The Global Online Food Delivery & Takeaway Market Research Report projects the global takeaway sector to be worth $50bn by 2026.
Customers expect convenience. Restaurants will need to embrace new ways of using data and information from ordering platforms to keep pace with these demands. The industry must create tailored loyalty platforms and ensure they implement the right reinforcements — whether that be more ad hoc staff to help with covers or additional ordering technology — during peak periods and public holidays.
Consumer eating habits have also evolved with vegan and vegetarian orders continuing their upward trajectory. Operators should pay close attention to how they can adapt their menus to cater to this growing category — without sacrificing their traditional menu items that remain popular with consumers.
We are also seeing an increase in restaurants either leaving aggregator platforms altogether or diversifying ordering channels to boost profits. The low contribution margins of online delivery orders due to commissions is draining profitability for these restaurants.
Instead, Q3 and Q4 is the time for restaurants to use white-label technology to build their own websites and apps to manage and process orders. These restaurants will either have their own delivery riders and drivers or contract last-mile delivery partners to deliver food directly to their customers.
For the end-consumer, this change could result in major savings given that these providers can cost consumers up to 40% more when ordering, according to Forbes. The time has come for control to go back to the restaurant, so they can protect their own relationships with their customers.
While doing this, restaurants must focus on user-friendly interfaces, ensuring easy on-platform order tracking and updates. It means implementing agile loyalty programmes that reflect customer demands to ensure retention and revisits, whilst also being transparent with existing customers about why they should order directly. A big part of this latter activation will be offering discounts on their first direct orders to get them through the door.
These are all crucial steps for operators to make in Q3, Q4 and beyond. And there’s good reason to be optimistic. Afterall, the US National Restaurant Association projects the industry’s sales will top $1.2 trillion by 2030 and the industry’s workforce — now 15.3 million — is predicted to hit 17 million.
It’s easy for restaurant owners to feel like they are fighting a losing battle. But with the right insights and attention to data, this Q3 & Q4, and beyond, is the time for operators to set themselves up for success and work towards a brighter future.
A note about the data
Due to the disruption of COVID-19, data sets look from pre-pandemic dates (2019) to the present (2022) for comparison. Due to various lockdowns in different operating countries, 2020 and 2021 data reflects that people were staying home more so web ordering and app ordering are especially high. This dataset is based on 1.7 million customers from 2019 to 2022 inclusive, in the United Kingdom, the United States, Ireland, France, Portugal, Germany and Spain.